by Sophie Pennetier, Enclos Associate Director – Special Projects
Explore with us Enclos’ latest achievement: our 2023 Environmental Product Declaration (EPD) for selected curtainwall benchmarks:
But what exactly is an EPD? It’s a comprehensive report that compiles information on everything from a product’s carbon footprint (global warming potential) to ozone depletion and water usage, amongst many other environmental metrics, from all life cycle stages. Whilst the data contained in EPDs informs design and procurement, we explain below why, at a granular level, the use of EPDs has pitfalls and requires caution. Our team of experts is here to help.
At Enclos, we design, manufacture, and install unique curtainwall systems for every project, requiring custom declarations for each design. Collaborating closely with our family of companies, Coalition and Enclos Tensile Structures (ETS), we’ve pooled our resources and expertise to embark on this sustainability initiative.
Our EPD framework actualizes years of research and collaboration on embodied carbon and circularity, such as the SFMoMA expansion facade Life Cycle Assessment with Stanford University in 2017, the Timber curtainwall R&D with UC Berkeley and other sustainability consultants in 2020, facade circularity workshops with architects, consultants and demolition specialists since 2020, etc. This informed review of our sustainability impacts today, including assessing the carbon intensity of a typical facade unit, helps strategize sourcing, design, manufacturing, strategic partnerships, and investments.
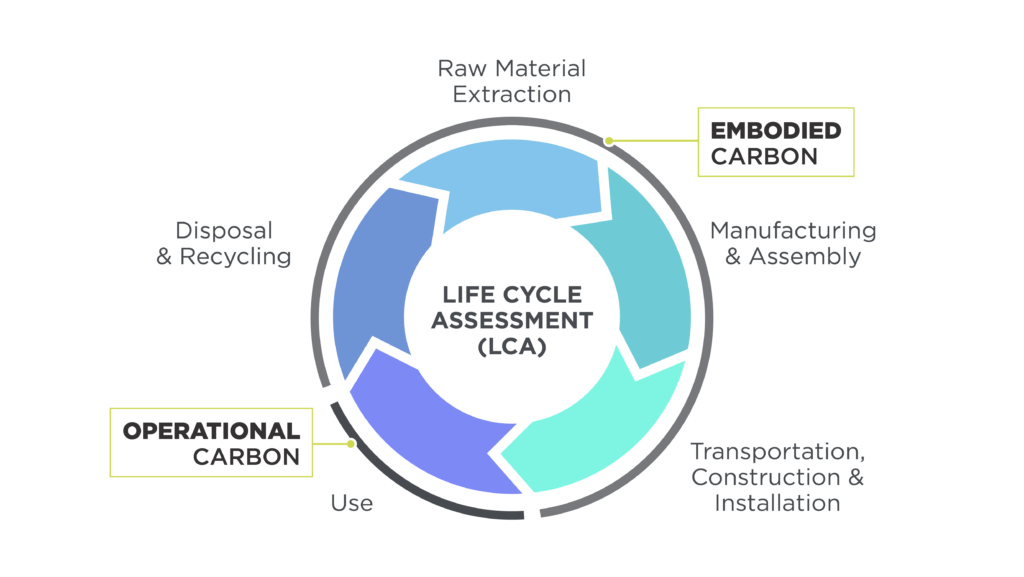
Facades are at the crossroads of embodied and operational carbon: these are, respectively, the upfront carbon emissions until building construction completion (embodied) and all remaining emissions during the building’s life (operational). The total of the two is called whole building life carbon (WBLC). The life expectancy of facade systems in the United States typically averages 50 to 70 years. In fact, our 100+ year-old company has built multiple facades whose life spans have exceeded 40 years, and we’re still counting. In 2024 (note that this data point is highly dynamic and project specific) the ratio of embodied to operational carbon of a building trends around, respectively 33% – 66% for one average building. In the next decades, through decarbonization of the U.S. energy supply, the embodied-to-operational ratio is expected to near 50% – 50%. The built environment represents 39% of human emissions, and the pace at which it will be decarbonized to meet the international Paris Agreement on Climate Change requires the highest scrutiny of all and any emissions now, not only in the future. In the meantime, the U.S. building stock needs several adjustments, including thermal improvement of facades, densification, and stock replenishment to meet population growth. Beyond the U.S., other markets, such as in Europe, have mandated zero-emission buildings from 20301. This market trajectory, already observed in U.S. coastal markets, is expected to grow with rising energy supply and prices coupled with executive mandates requiring reduced carbon.
Operational Carbon: Operational beats Embodied beats Traditional (W. Roth2)
Like an investment portfolio, the whole life carbon of a project is based on long-term and short-term considerations3. Typically facades represent 15-25% of a building’s embodied carbon, that’s 5-8% of the whole life carbon, yet they represent the highest leverage on operational carbon emissions which is 66% of whole life carbon. This is why, for the past decades and appropriately so, the focus of facades design has been (and needs to remain) on operational performance: thermal insulation, solar heat gain management, and air tightness control are the best ways to reduce the “66% part of the carbon pie” (See Fig. 2). All the necessary technology to effectively reduce embodied carbon is available now. As the Project Drawdown’s Executive Director Jonathan Foley, states: “think now not new, think time not tech4”. Considerations about orientation and opacity of the facade, including window to wall ratio, passive cooling and shading strategies, alongside high-performance facade thermal design, are essential to the mitigation of operational carbon and the largest environmental impact from facades. Some of these essentials have been integral to traditional architecture for centuries, yet secondary to aesthetics or cost when energy prices have dropped during the last two centuries. Today designers can leverage data to validate the carbon performance of facades and improve upon the status quo. Like any healthy portfolio, the effects of carbon in the atmosphere and on climate change compounds over the years. The best time to save carbon is now, and this means, in order of priority, extending the life of existing buildings (avoiding new structural embodied carbon) by thermally improving their facades (correcting their significant operational carbon emission) and generating low-carbon structures with carbon-balanced facade design for construction.
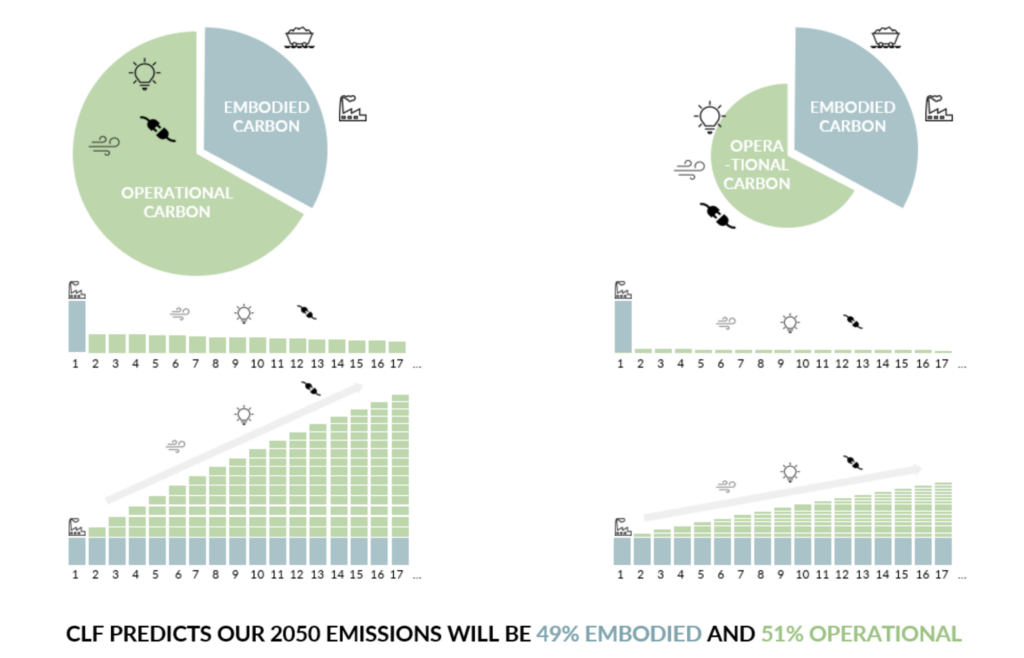
Embodied Carbon: Price is what you pay, value is what you get (W. Buffet)
Once operational carbon solutions have been strategized into the design, the embodied carbon of facades (15-25% of the building’s embodied carbon and about 8% of the whole life carbon) requires the remainder of the design team’s attention. The envelope of a building is subject to water, wind, seismic racking, ice, temperature variations, and other environmental conditions, including fire. Those harsh conditions typically require highly durable, non-flammable materials, usually energy-intensive metals or ceramics, as well as environmentally supercharged sealant or gasketry. The tactful mission of the curtainwall designer is to leverage the mindful use of each material or component to realize the most balanced design, from a durability standpoint, with essential considerations of performance, legal warranties, assembly method, and cost. Doing so, the curtainwall design follows a holistic workflow with a system intelligence that comports partially replicable (connections, tool access, QAQC rates) combined with a partially non-replicable wager (custom equipment development, new materials system integration, scheduling of new vendors, market pressures, etc.). All these aspects inform the type and size of components, which yields the material logs to be processed for sustainability evaluation and narrowly converted in a carbon balance sheet. On the one hand, any reporting requires simplification, but so does any evaluation and decision-making. Narrowing in on the look of a product, its cost, or speed of construction trumps the thoughtful consideration of the larger arc of impacts such as climate change, pollution of aquifers, water or ozone depletion, all the way to politics and justice. Since the value of design spans beyond the mere metrics we communicate with, the wisdom in facades’ design consists in balancing the near term and long term. In the near term, our industry must reduce its sustainable footprint now with the intent of limiting its long-term footprint.
Embodied carbon legislation and materials decarbonization trends
While acknowledging the entanglement of the carbon levers and data, multiple practical synergies are being implemented: the state and federal legislation on embodied carbon derives from industry gauging and feedback on:
- Current carbon trends (industry averages)
- Next practical step in decarbonizing (capital investment and immediate room for optimization)
- Mindful quantification (definitions, accounting rules, and thresholds, production stages)
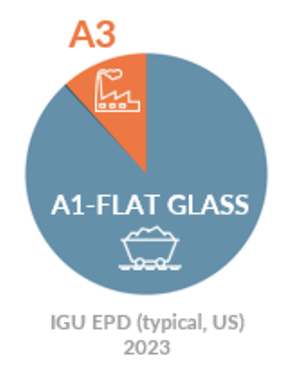
Glass products EPDs reveal the highest emissions during the most energy-intensive step of melting the glass to produce flat sheets. This trend is similar for many other materials such as cement, aluminum and steel. This observation is dynamic, and as all industries decarbonize, other stages may grow in relevance. Mindfully, state legislation (such as the BCCA in California) and federal low-carbon procurement (via the IRA) require ‘flat glass EPD’ to monitor the highest contribution to the carbon footprint of glass and glass facades. Conversely, there are fewer glass float plants than there are glass manufacturers who buy these sheets and post-process them (ie, cutting, Low-E coating, tempering, fritting, laminating, etc.), which is not as easy to monitor and report. Those generally are smaller businesses that do not necessarily have the means to implement and produce custom reporting. The legislative carbon threshold for glass is directly derived from the industry average. The low-carbon tiers (specifically under IRA) are directly informed by what the industry can achieve with immediate optimization. Legislations comport various clarifications on the applicability of (or lack thereof) flat glass EPDs as a proxy to evaluate glass products using weight/cost percentages5, manufacturing operations and alike, and reporting conditions (document type etc.). Contact us or our glass suppliers for guidance.

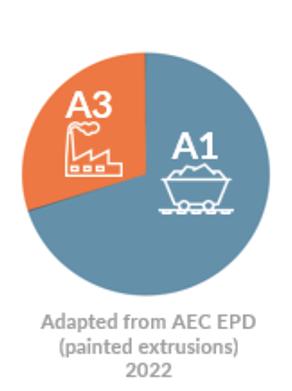
Aluminum extrusions are the next highest embodied carbon footprint in curtainwalls after glass. Similarly to glass, the most emissive stage of aluminum extrusion production is, in the current state of the market, during the smelting stage. This highly dynamic status of aluminum production, which is rapidly decarbonizing, generally means that it does not matter (in 2024) where the aluminum billet comes from and where it goes as long as it has been produced with the greenest possible energy. Recycled content notionally helps reduce the energy need but is generally not the most significant lever in decarbonizing aluminum. More information on Facades Carbon is available through the Facades Tectonics Institute Embodied Carbon resources.78
Curtainwall embodied carbon: Enclos EPDs review
The earliest published work on Enclos’ systems embodied carbon was developed by Stanford University for the SFMoMA extension facade in 2017. Most recently, in 2020, UC Berkeley Master student Isabelle Hens (now with A10) published a high-level review of a benchmark of Enclos systems with various frame materials (aluminum, timber) and supply chains. This work combined industry material average data (aluminum association, now superseded by the AEC EPD) with extrapolations from supplier-specific EPDs, and was based on quantity takeoffs and performance criteria different from Enclos’ current EPDs. It did, however, provide, four years ago, a clear picture of the best opportunities to decarbonize our systems and develop our own in-house tools9. The development of Enclos’ EPD in 2023 was performed by sustainability consultants WAP under ISO 14025 & 21930, per the IBU 2022 Product Category Rule (PCR) for curtainwalling. The goal of this approach is to comply with ISO 21930 per UL Part A and align with other North American curtainwall EPDs. While comparison between systems is not recommended since they don’t have the same performance specifications, using the same framework will help, in the future, consolidate efforts and reference when applicable. Today, comparing the EPDs publicly available, including ours, would be equivalent to comparing cars from Prius and Golf: they both have four wheels and roughly the same size, but their sourcing, performance, mileage, and maintenance are relatively different and calls into question the validity of a comparison since their function (at a fine level) is not identical. It, however, provides excellent insights for in-depth conversations with clients about what matters most to them: an affordable car with low mileage that needs to be replaced in 15 years? A durable product that can last orders of magnitude longer and stay out of landfill10? What are the product’s compounded impacts on the environment over 70 years? The answers are specific to the project, and client strategies spanning beyond the product and project itself. Enclos sustainability taskforce is structured to contribute to such evaluations by the clients.
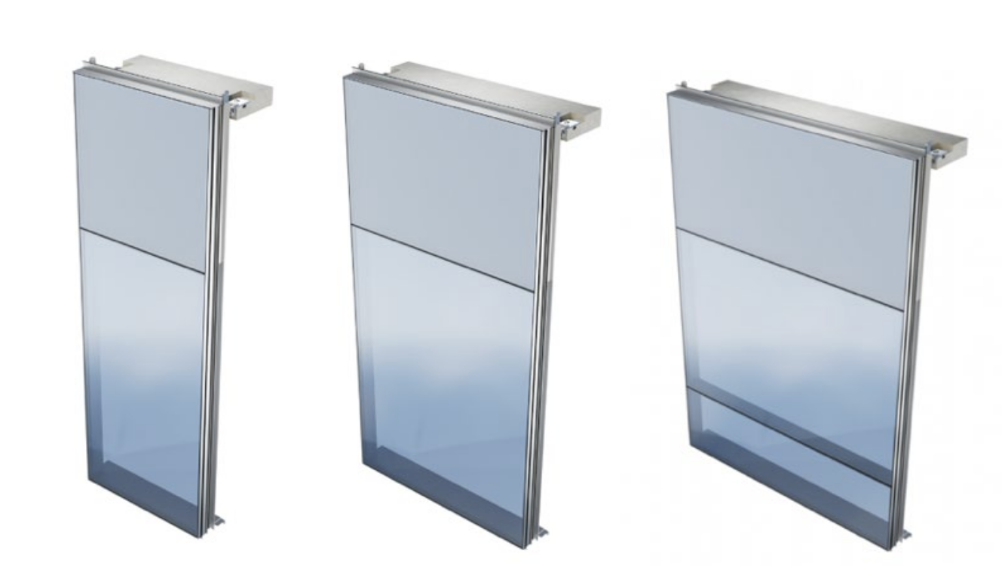
Enclos 2023 EPDs cover two categories:
Each category includes three unit geometries:
- 5 x 15ft
- 7.5 x 15ft
- 10 x 15ft
The analysis is based on the AEC EPDs (explaining our two EPD categories) combined with either supplier-specific EPDs when available or regional proxy when such EPDs aren’t available yet, per ISO 14025 & 21930.
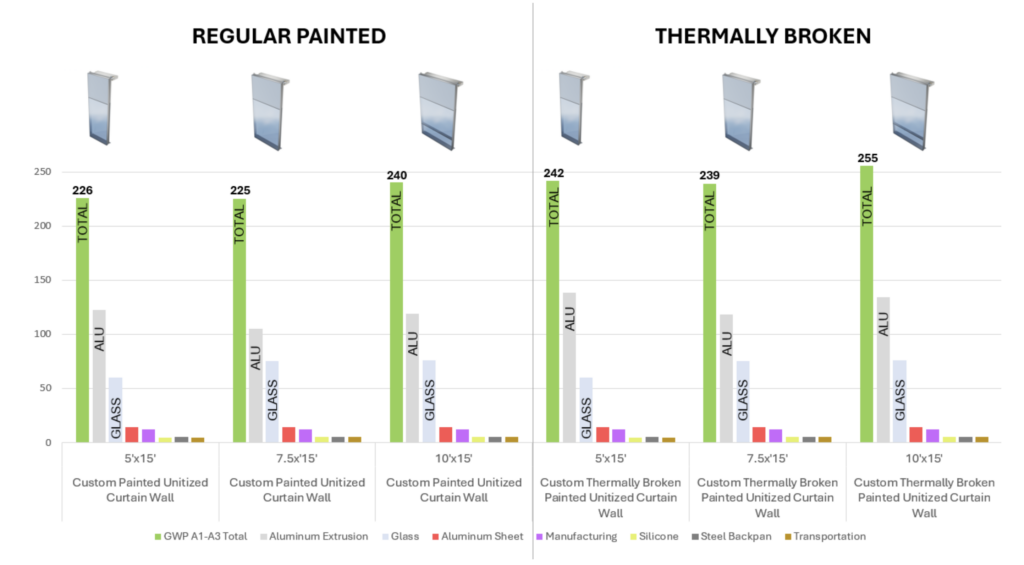
The embodied carbon11 of the narrow units is approximately the same (5 and 7.5ft), compared to the 10ft wide unit requiring an intermediate transom to limit the excessive thickening of the glass. Other environmental metrics follow the same trend as embodied carbon. The difference between thermally broken and non-thermally broken results stems from the pool of AEC extruders that offer thermally broken solutions. The difference between the two is not related to the nature of the materials or technology, rather, the pool of extruders included in the non-thermally broken EPD lowers the overall number. It represents a 9.5% increase in the average number, reflected in our EPD. The AEC is currently working on a producer-specific tool that will enable extruders to produce their own EPD, allowing us to refine the carbon accounting of our own products.
Apple to Apple and Fish to Oranges (E. Patrick)
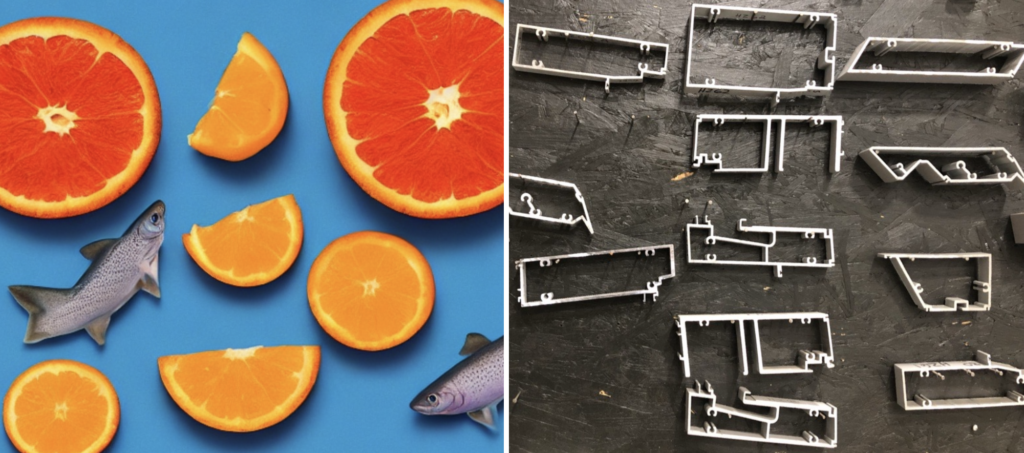
Comparing EPDs is a great basis for conversation between all stakeholders, provided all parties acknowledge the limitations of the process, its inherent inaccuracies, and the data noise due to a process that is generally in its infancy in the United States. For instance, some sub-products PCRs allow for a very high data noise making any comparison under the exact same PCRs irrelevant below a 10%-15% figure, even for the exact same function and specifications. Yet most available EPDs have different functions and specifications (life expectancy, air tightness, wind loads, expected life span and warranties, etc.). As Earl Patrick, Design Director with Enclos, coined it: “You may have as many calories in a serving of fish and an orange, but from all other aspects, they are different.” The same goes for comparing facade systems without sufficient detail on performance. This is why Enclos has a dedicated Sustainability taskforce to accompany our clients, vendors and colleagues throughout the sustainability assessment and procurement journey.
Aluminum extrusions carbon accounting differs significantly under different PCR12. Namely, Europe and the U.S. have different accounting methods for recycling. To put it simply13, the carbon emission associated with discarded products is accounted as null in Europe and full in the U.S. For example, if an extruder produces more extrusion than necessary and recycles it, the emissions for producing these additional extrusions will be accounted for in the U.S. and disappear from its European extruder counterpart’s carbon ledger. Depending on the size of the order and various other parameters specific to the extruder and the project, this difference may yield a 10-15% difference for the accounting of the same extrusion carbon footprint. EPDs shall be requested per the project region’s PCR. In a nutshell, comparing U.S. data with data from any other overseas region compounds inaccuracies and noise in the evaluation.
What’s next for our sustainability task force? For the past four years, we have been tuning up our embodied carbon assessment tools, engaging in workshops with our suppliers, and advocating in critical industry associations committees (e.g. AEC, NGA, FTI) within the US and internationally. Next, we are growing our carbon-informed monitoring activities and design solutions.
Contact our sustainability team at sustainabiliy@enclos.com to discuss solutions tailored to your project, we look forward to hearing from you!
- https://www.europarl.europa.eu/doceo/document/A-9-2023-0033_EN.html
↩︎ - This fictional quote, not by Sen. William Roth, draws a parallel between carbon strategizing and retirement investing, echoing the strategy “Match beats Roth beats Traditional.” ↩︎
- https://usglassmag.com/insights/2023/07/time-value-of-carbon-leveling-the-playing-field-between-operational-and-embodied-carbon/ ↩︎
- https://www.ted.com/talks/jonathan_foley_the_climate_solutions_worth_funding_now?language=en ↩︎
- e.g. IRA’s “80/20” assembly rule from EPA’s Interim Determination — at least 80% of IGU weight must be compliant flat glass, which differs from the BCCA consideration that an IGU cannot use a flat glass EPD proxy (https://www.glass.org/advocacy/initiatives/legislation). ↩︎
- https://www.gsa.gov/real-estate/gsa-properties/inflation-reduction-act/lec-program-details/lec-pilot-fact-sheet ↩︎
- FTI Website: https://www.facadetectonics.org/articles/embodied-carbon ↩︎
- FTI Facades Carbon podcast: https://podcasts.apple.com/us/podcast/embodied-carbon/id1512988779?i=1000501283634 ↩︎
- Youtube CLF Presentation by I. Hens and S. Pennetier: https ://www.youtube.com/watch?v=2snRqA2e1lw ↩︎
- Glass recycling 2023 status: https://www.recovery-worldwide.com/en/artikel/recycling-a-multifunctional-material-4017129.html
↩︎ - Global Warming Potential (GWP) refers to carbon emissions indistinctly of its source or stage. However within the field of embodied carbon analysis, the two terms are interchangeable. Within an EPD the term GWP is used, and the term “embodied carbon” is used in whole life carbon studies when dissociated from “operational carbon”.
↩︎ - PCR: Product Category Rule, defines the methods of carbon accounting, the threshold below which not to report the data (for example fasteners represent such a small weight and carbon footprint that the PCR permits to omit them from the total carbon balance sheet). ↩︎
- This statement is an oversimplification. Please contact us or your aluminum vendor for further detail applicable to your project. ↩︎
